
A single tokens-per-second number cannot describe an AI service. Buyers need to know which tokens were counted, how many requests were active and how long people waited.
Tokens are workload units, not words
The tokenizer converts text into model-specific units. The same sentence can produce different token counts across checkpoints. Image and other multimodal inputs may introduce their own token accounting.
Always name the tokenizer or exact checkpoint when comparing token counts.
Input and output work are different
The model first processes the prompt. It then generates output token by token. A long document with a short answer stresses the service differently from a short question with a long answer.
Report input and output lengths separately, including their distribution rather than one favourable example.
Time to first token
Time to first token measures how long a streaming user waits before generation begins. It includes queueing and prompt processing. For chat and interactive coding, this delay often shapes perceived responsiveness.
Report median and tail percentiles. An average can hide the experience of users waiting behind long requests.
Inter-token latency and decode rate
After the first token, inter-token latency describes the pauses between generated tokens. Its reciprocal is often presented as an output rate.
Clarify whether a rate is per request, per user or aggregated across the server. Aggregate throughput can rise while each individual stream becomes slower.
End-to-end latency
End-to-end latency runs from request submission to final response. It is the most direct measure for a bounded extraction, classification or batch job.
For streaming chat, show end-to-end latency alongside time to first token and output length.
Throughput
Throughput reports work completed per unit of time: requests, input tokens, output tokens or total tokens. Each answers a different capacity question.
No throughput claim is comparable unless the model, hardware, runtime, prompt distribution, output distribution, request rate and concurrency are disclosed.
Concurrency is active work
Named users are not concurrent generations. Establish how many requests are in flight at the peak, how often they arrive and whether they may queue.
Test more than one load point. A useful curve shows when latency starts to degrade and where errors or memory pressure appear.
Warm-up, caching and speculative decoding
Compilation, model loading and cold caches can affect early requests. Prefix caching and speculative decoding can change results for suitable traffic.
State whether warm-ups ran, whether caches were flushed and whether prompts shared prefixes. Optimisations are valid, but hidden conditions make the result misleading.
A minimum benchmark row
Record:
- exact checkpoint and weight revision;
- runtime, container, driver and CUDA versions;
- GPU model, count, topology and power state;
- input and output length distribution;
- request rate, batch and maximum concurrency;
- time-to-first-token and end-to-end latency percentiles;
- per-request and aggregate output throughput;
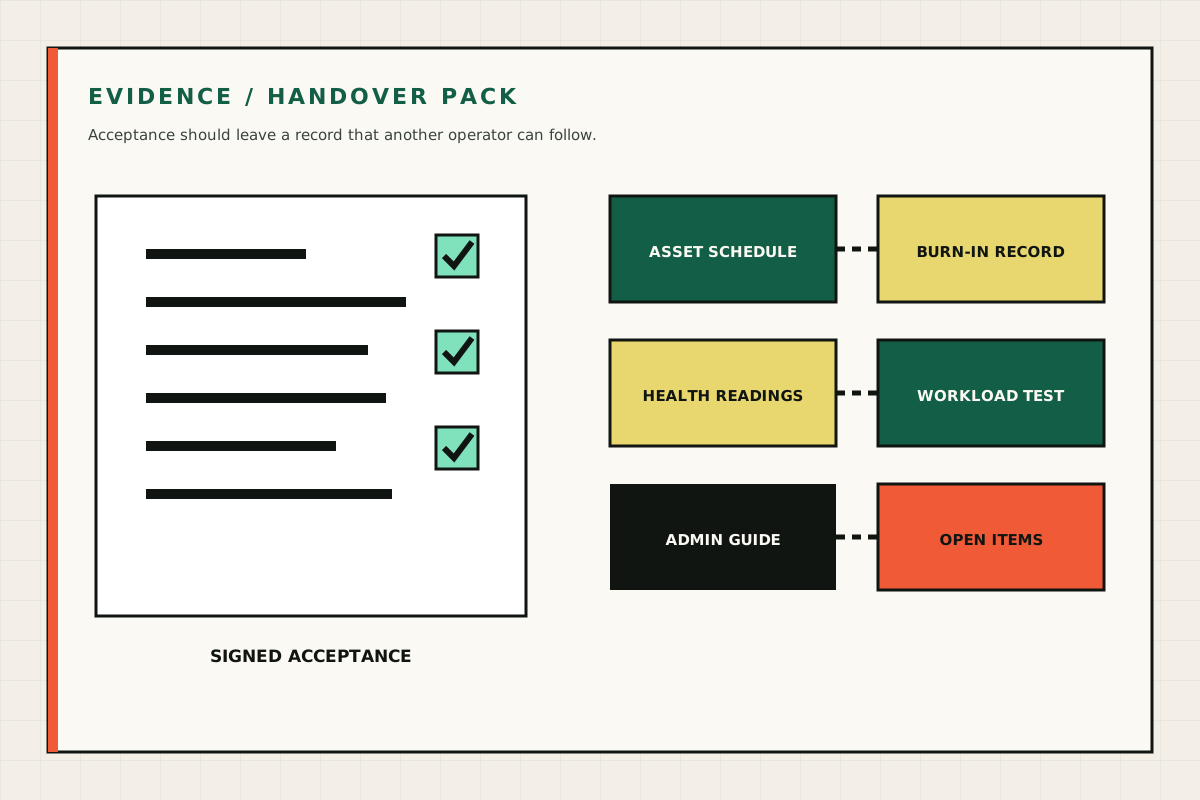
- completed requests, errors, memory, power and temperature.
The useful success measure depends on the workload. A support desk may value the 95th-percentile first-token wait; a batch pipeline may value completed documents per hour.
Technical context
See the physical and operating boundary
Use these views to connect the guide to the machine, its airflow and its operating environment. Captions state the limits of what each image shows.


Primary sources
- vLLM serving benchmark documentation
- SGLang bench serving guide
- NVIDIA TensorRT-LLM performance overview
Sources are checked at the review date. Platform terms, prices and public guidance can change; verify them at the point of decision.