Operating-cost tool

Calculate On-Premise AI Server Electricity Costs

Use measured wall power when available. GPU TDP is not whole-system demand.
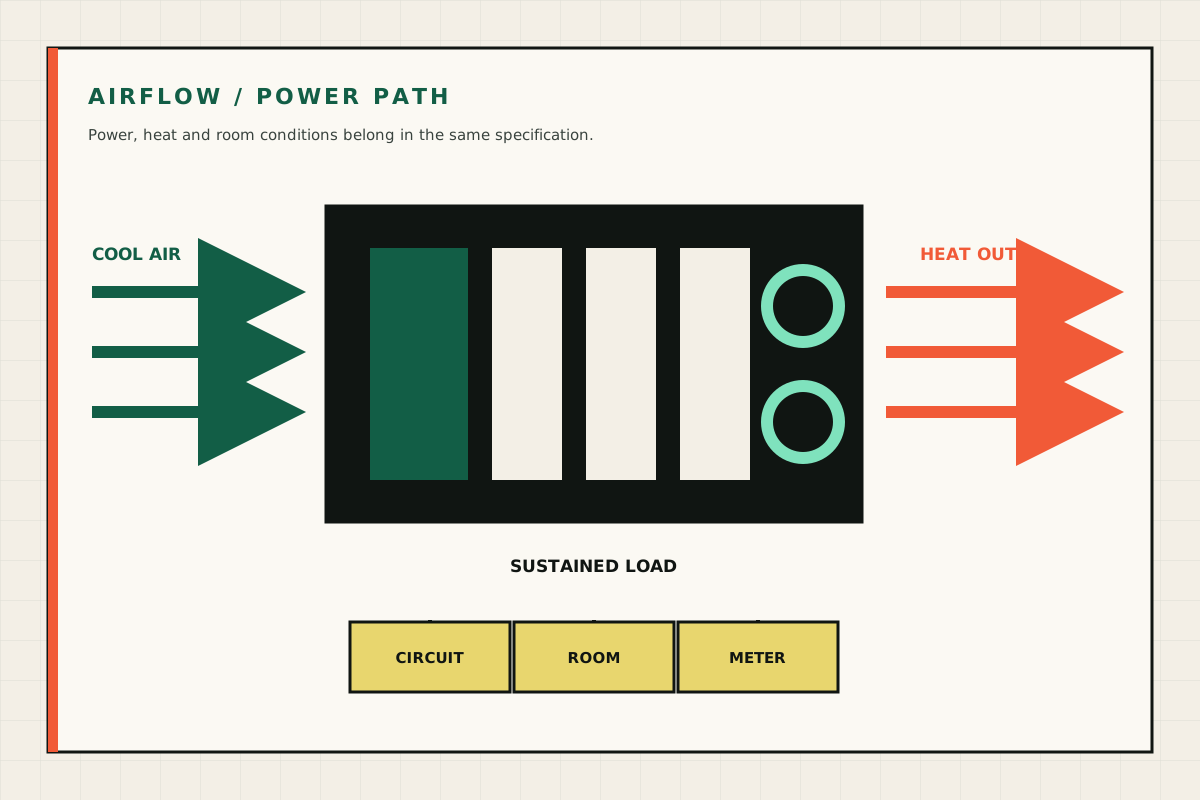
Diagram of cool air entering a rack server, heat leaving it and checks for the circuit, room and meter
Power, airflow and room conditions form one site-readiness decision rather than three separate afterthoughts. GPU Servers technical illustration.
Power, airflow and room conditions form one site-readiness decision rather than three separate afterthoughts.
Dated public UK business input; replace with your contract rate.
1.0 means no overhead; 1.2 adds 20%.

Estimated annual electricity

£0

  • Annual energy0 kWh
  • Monthly average£0
  • Five-year energy, same inputs£0

Scenario only. Excludes standing charges, tariff changes, support and hardware cost.

Calculation record

See what sits behind the result.

The controls are deliberately editable. Record the values used, the date and the source before relying on an output in a buying decision.

01

Method

  • Annual kWh = load kW × powered hours × days × loaded utilisation × facility factor.
  • The facility factor represents cooling and other site overhead. A value of 1.20 adds 20%.
  • Use measured whole-system wall power and the organisation’s contracted unit rate where available.
02

Worked reading

  • At the default 1.5kW, 24 hours, 365 days, 35% load and 1.20 facility factor, the model estimates 5,519kWh a year.
  • At 24.14p/kWh that is about £1,332 a year before standing charges.
  • Raise the tariff and utilisation inputs to create a downside case.
03

Do not infer

  • This is not an electrical design, cooling survey or supplier power guarantee.
  • It excludes standing charges, tariff movement, maintenance and demand-related charges.
  • GPU TDP is not a substitute for whole-system measurement.

How to use the result

Measure the complete server at the wall during the accepted workload. Use actual operating hours and a realistic loaded-utilisation figure. Add the site’s cooling or facility overhead, then test higher tariff and utilisation cases.

Read the full power, cooling and noise guide.

Decision check

On Premise AI Server Electricity Costs: Read the Result in Context

For on-premise AI server electricity costs, keep the inputs, inputs, sensitivity and supported decision visible beside the result.

Use on-premise AI server electricity costs as a planning aid, then confirm live prices, technical fit and professional advice where relevant.

Cooling and serviceability are part of the purchase.

Site power, heat rejection, noise, airflow and maintenance access are matched to the selected system.

Diagram of cool air entering a rack server, heat leaving it and checks for the circuit, room and meter
Power, airflow and room conditions form one site-readiness decision rather than three separate afterthoughts. GPU Servers technical illustration.
Hot-swap GPU server cooling fan module with a pull handle and protective grille
Supplier component image showing the removable cooling fan design used for service access. OEM supplier reference image.
Open 4U OEM GPU server chassis showing passive GPUs, cooling fans, processors and memory slots
OEM supplier render showing one possible internal layout. Components vary with the ordered build. OEM supplier reference image.
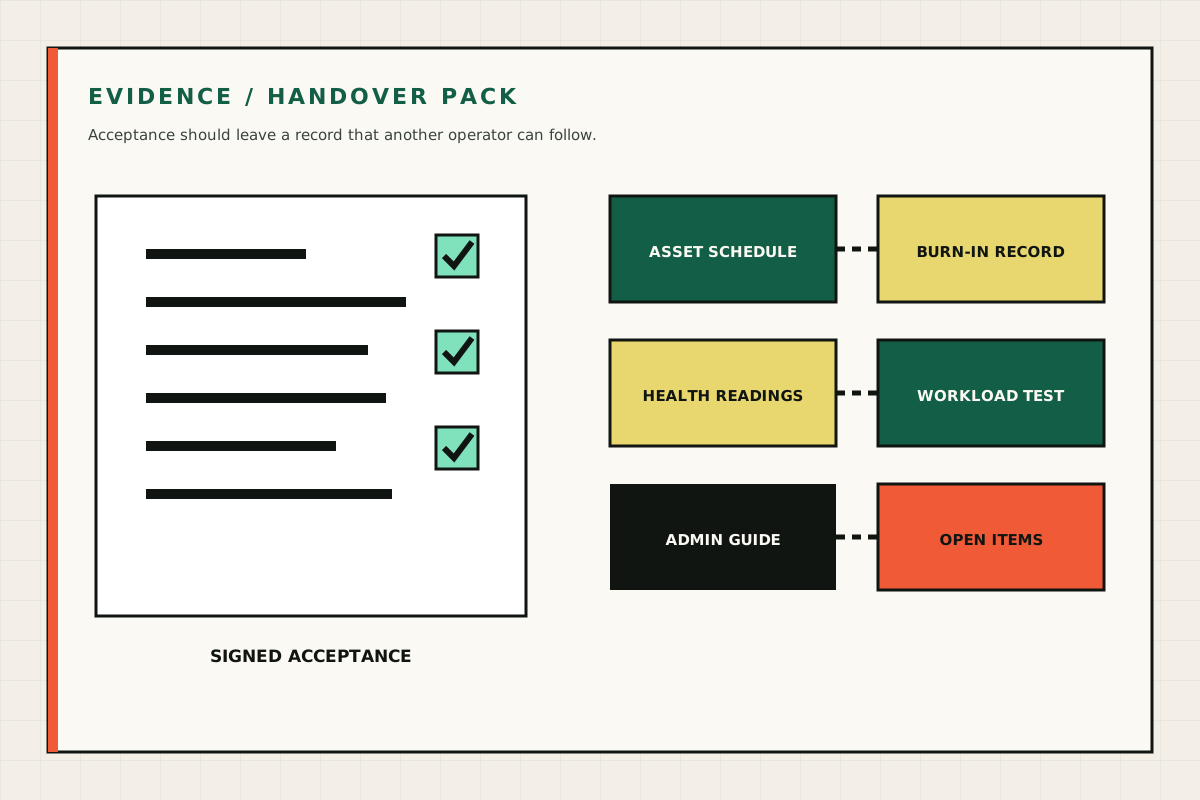
Diagram of an evidence pack containing an asset schedule, burn-in record, health readings, workload test and admin guide
A complete handover includes the supplied assets, test results, operating instructions and agreed follow-up work. GPU Servers technical illustration.