
Whole-life comparison

Use the AI Server TCO Calculator to Compare Five-Year Costs

A server does not become cheaper because somebody divides its price by users. Compare the whole service.
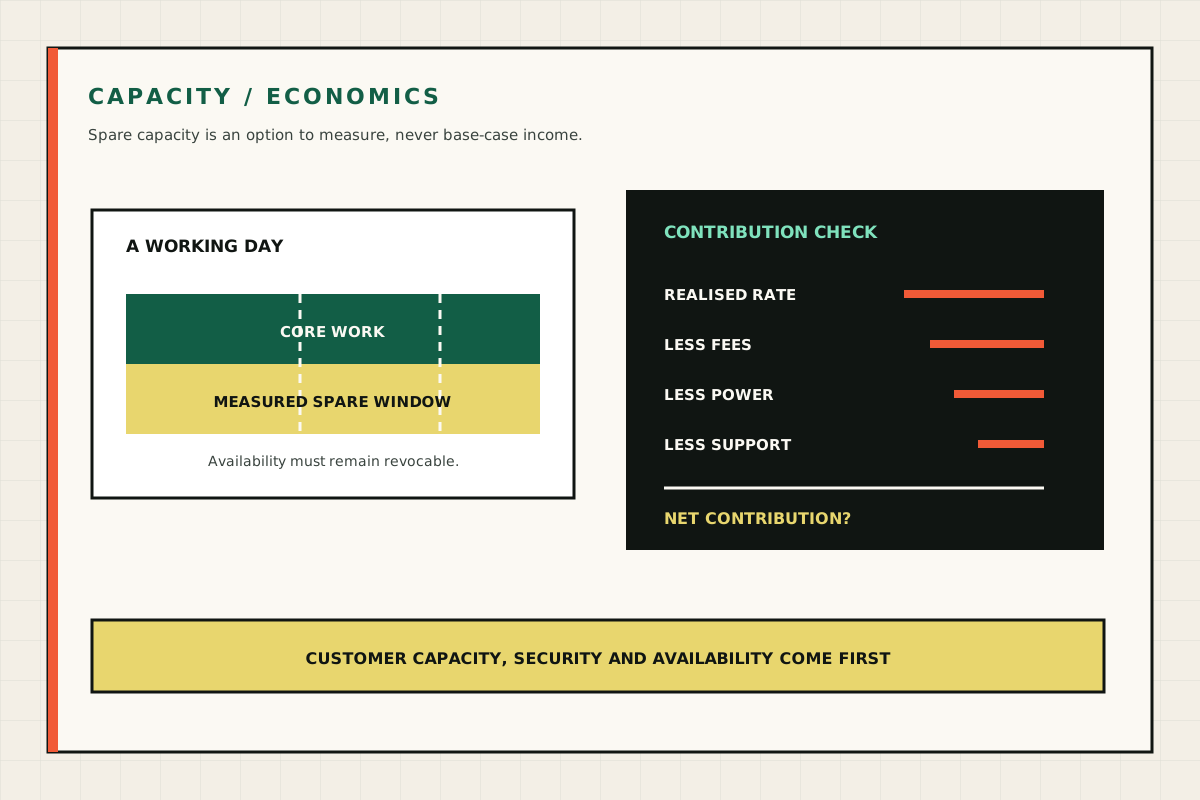
Diagram separating core business work from spare capacity and deducting fees, power and support from any realised rate
Spare-capacity income remains optional upside after fees, electricity, support and customer availability are accounted for. GPU Servers technical illustration.
Spare-capacity income remains optional upside after fees, electricity, support and customer availability are accounted for.
Keep zero in the base case unless supported.
Dated comparison input; update from the provider and exchange rate.

Five-year difference

£0

  • Owned-capacity TCO£0
  • Hosted-seat total£0
  • Owned equivalent per month£0

Not a quality-equivalence claim. Excludes implementation common to both routes, tax relief and speculative spare-capacity income.

Calculation record

See what sits behind the result.

The controls are deliberately editable. Record the values used, the date and the source before relying on an output in a buying decision.

01

Method

  • Owned TCO = purchase + finance + five years of energy, support and facility cost − supported residual value.
  • Hosted total = paid users × annual seat cost × five years.
  • The comparison deliberately excludes tax relief and spare-capacity income from the base case.
02

Worked reading

  • The defaults compare a £27,500 reference system plus £4,000 annual operating cost with 25 hosted seats.
  • A cash difference does not establish quality or feature equivalence.
  • Run a light-use case, a measured central case and a higher-cost downside case.
03

Do not infer

  • Hosted seats include a managed product and current provider model access.
  • Owned capacity needs technical ownership, accepted local models and a site.
  • Exchange rates, provider features, hardware prices and support needs can change.

Read the comparison carefully

Hosted seats include a managed product and current model access. Owned capacity needs an operator and may use a different model. Control, offline operation and local integration can have value even without a pure cash crossover; name that value rather than hiding it in savings.

Read the complete seat comparison.

Decision check

AI Server TCO Calculator: Fit, Evidence & Next Steps

Use the AI server TCO calculator with current workload, cost and operating inputs, then test how the result changes when the important inputs move.

Relevant supporting considerations include AI server cost, private AI TCO and cloud vs local AI cost. The AI server TCO calculator result is a planning aid; retain the inputs, evidence date, downside case and any checks still required before purchase.

Commercial value starts with a complete cost boundary.

Include installation, energy, support, finance and adviser-confirmed tax treatment. Potential spare-capacity income should remain optional upside.
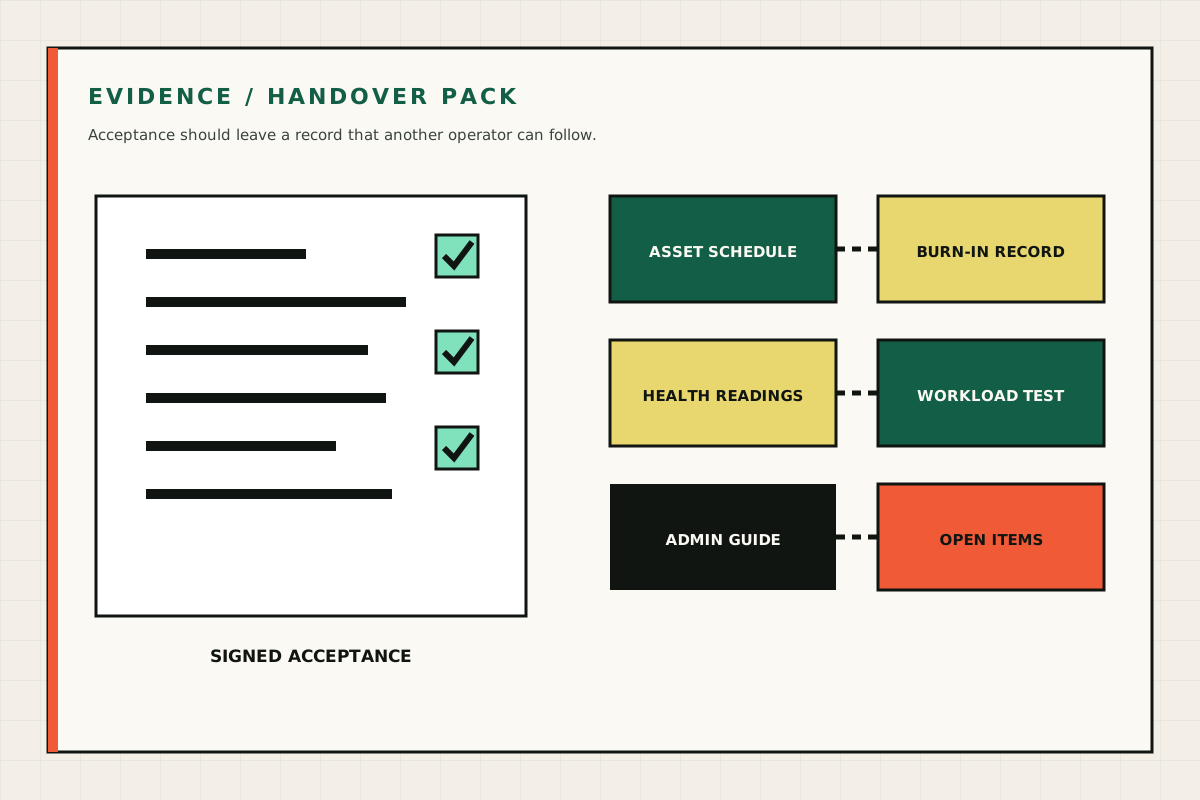
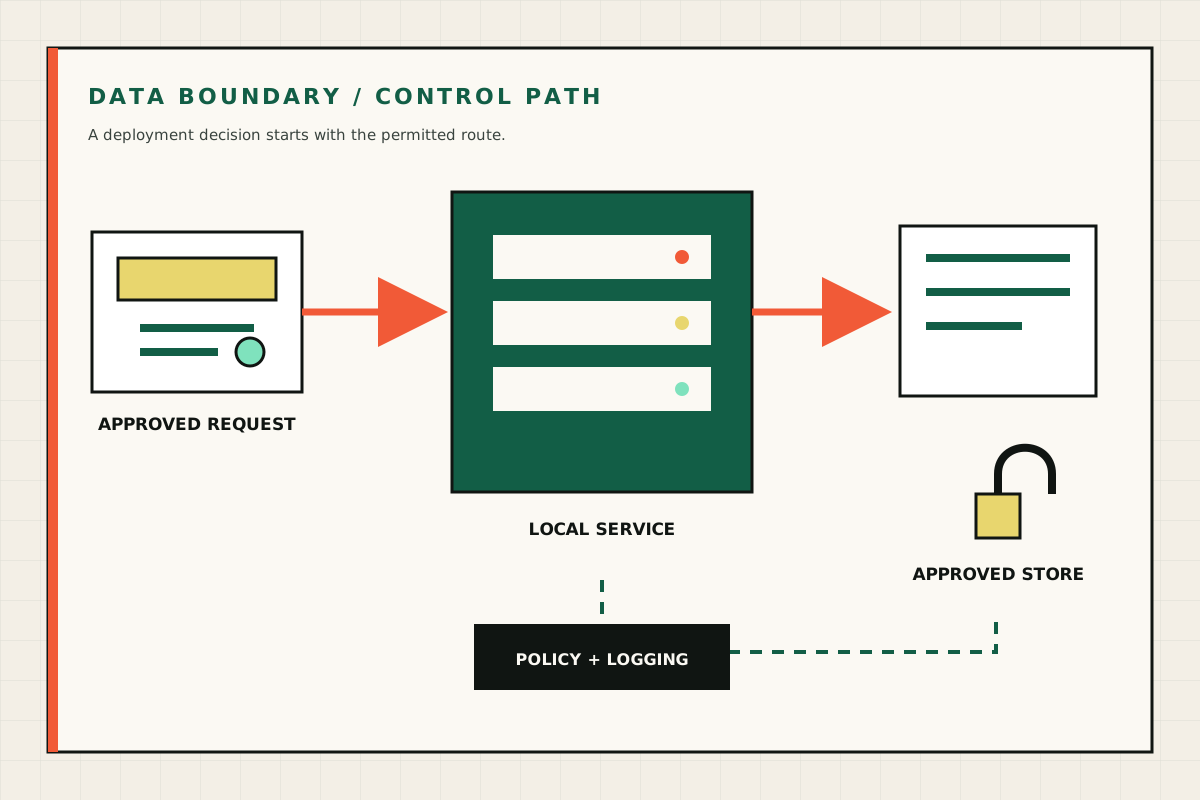
Diagram separating core business work from spare capacity and deducting fees, power and support from any realised rate
Spare-capacity income remains optional upside after fees, electricity, support and customer availability are accounted for. GPU Servers technical illustration.
Diagram of an evidence pack containing an asset schedule, burn-in record, health readings, workload test and admin guide
A complete handover includes the supplied assets, test results, operating instructions and agreed follow-up work. GPU Servers technical illustration.
Diagram showing an approved request, a local service, an approved store and a policy-controlled data path
A private deployment starts with the permitted data path, access policy and logging boundary. GPU Servers technical illustration.
Three-quarter supplier render of a 4U OEM multi-GPU rack server
OEM platform reference render showing the rack-server form and external service access. OEM supplier reference image.